

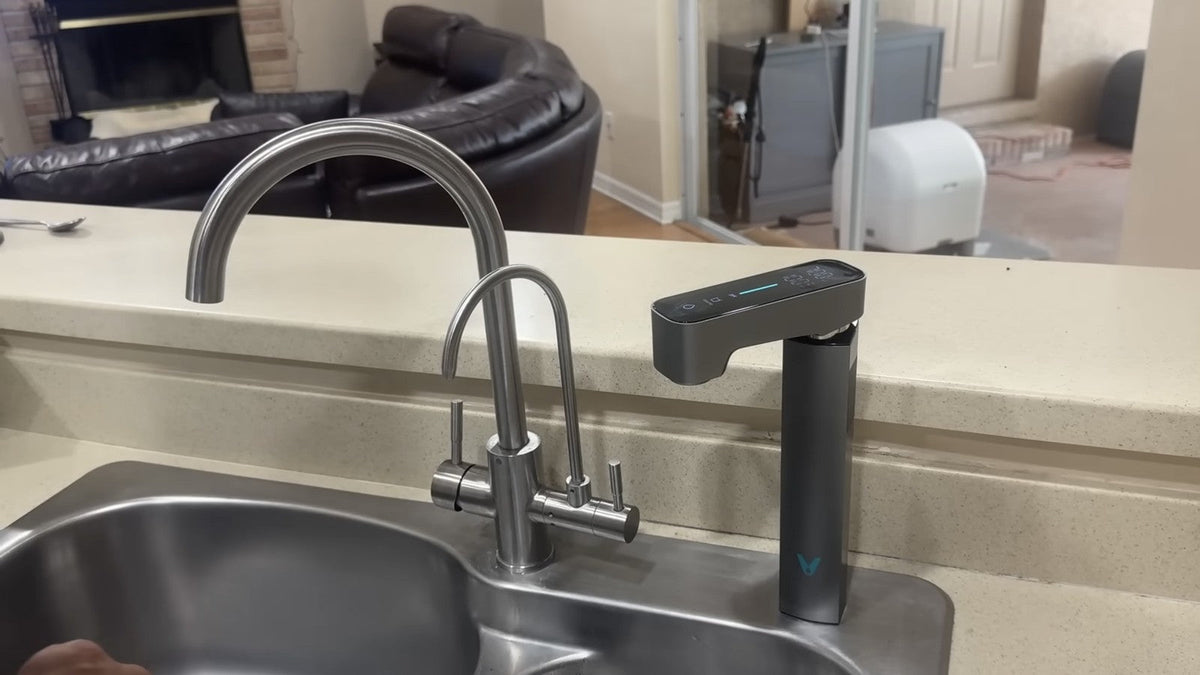
Judge the number while water is flowing, not after it stops, and compare it with an independent reading. A TDS display works by measuring the conductivity of water in contact with its probe, so a display that is measuring the water changes when the water changes. The practical test is simple: create a real change in the water (the first draw after the system has rested is the easiest one), measure each draw with a handheld TDS pen, and see whether the faucet number moves the same way the pen does. If the pen shows a clear change between two draws while the faucet shows identical digits, the faucet digits didn't follow the change the pen measured. When that happens again on other mornings, the faucet number isn't tracking the water you're drawing.
What the Number After the Water Stops Can Mean
A number left on screen after the faucet closes can't be judged on its own. Depending on the display, it can be the last value from the draw you just finished, or a reading of water that is now sitting still. The screen at rest doesn't show which, and neither one is a reading of a new draw. That's why the reliable answer comes from the next draw: when water flows again, a display that is measuring the water follows it, while a held number stays where it was.
A quick check without a pen
The first draw of the morning is the easiest moment to look. Note the number before you open the tap, then watch it from the moment water starts until the flow has been steady for a while. If the number moves during the draw, the display is updating as water passes. If it never moves at all, that alone isn't proof of a cached value, because RO water can genuinely read the same from one draw to the next. That's when the pen comparison below adds the missing piece: an independent reading of the same water.
How a Faucet TDS Reading Works
TDS stands for total dissolved solids, the combined amount of material dissolved in water, usually reported in parts per million (ppm) or milligrams per liter (mg/L). In tap water and RO water, most of that is dissolved minerals and salts. A smart faucet doesn't weigh those solids. It estimates them from electrical conductivity.
The U.S. EPA describes conductivity as "a measure of the ability of water to pass an electrical current." In a conductivity probe, "voltage is applied between two electrodes in a probe immersed in the sample water," and the drop in voltage caused by the water's resistance is used to calculate conductivity (EPA, Water Monitoring and Assessment: Conductivity). Dissolved mineral ions carry that current, which is why conductivity tracks dissolved mineral and salt content.
Three details from the U.S. Geological Survey's field manual on specific conductance shape how you should run a home comparison:
- Conductivity is used to estimate TDS. USGS notes that conductivity measurements "are typically used to estimate the concentrations of total dissolved solids." A TDS pen and a faucet display both report that kind of estimate in ppm.
- Temperature matters. Conductivity "increases by 0.5 to 3 percent per degree Celsius," and USGS notes that most modern specific conductance meters are temperature compensated, reporting the value corrected to 25 °C (77 °F). Testing each glass promptly, in the same way every time, keeps your comparisons consistent.
- Record the stabilized value. In field work, USGS has technicians hold the probe in the water until it "equilibrates," judge that by watching the reading stabilize, and record "the stabilized value." It also warns that gas bubbles on the probe surface produce an inaccurate reading.
Put together, this means the readings worth comparing are the ones taken while water is running and the number has settled. For this comparison, pair faucet readings recorded while water is dispensing with pen readings of water collected during the same draw. That keeps the faucet number and the pen number describing the same water.
What a TDS Reading Can and Can't Tell You
Before running any test, it helps to know what you're confirming. A live TDS reading is an excellent daily signal of how much dissolved mineral and salt content is in your water, and a shift from your usual stabilized value is a good prompt to look at filter life and recent usage. The EPA lists 500 mg/L as the secondary (non-enforceable, aesthetic) standard for TDS, tied to effects like salty taste, deposits, and staining (EPA secondary standards).
TDS is a combined measurement, though. It doesn't identify individual contaminants such as lead, PFAS, or microplastics, and it isn't a test of membrane integrity on its own. Contaminant-reduction performance comes from model-specific laboratory testing, while the faucet display is your everyday view of overall dissolved-solids levels. For a deeper primer, see Viomi's complete guide to TDS and water quality testing.
What to Compare: Signs of a Live Reading vs. a Held Value
| What you compare | Consistent with a live reading | Consistent with a held value |
|---|---|---|
| First draw after an overnight rest vs. a draw after a long run | Faucet numbers differ when the pen numbers differ | Faucet shows identical digits while the pen shows a clear difference |
| Faucet number before opening the tap vs. during flow | Number during flow follows the water, whatever was on screen before | Number during flow never departs from the pre-opening value, even when the pen shows the water changed |
| Faucet vs. pen across several days | Both rise and fall together | Pen moves from day to day, faucet stays fixed |
The pen readings are what make this test work. A steady faucet number on its own is not proof of anything, because RO water can genuinely read the same draw after draw. The question is whether the faucet number moves when independently measured water moves.
A Five-Step Test You Can Run at Your Sink
You need a clean glass, a handheld TDS pen calibrated according to its own instructions, and a notepad or phone. Before you start, test the same glass of water with your pen three or four times, letting the reading stabilize each time, and note how far apart those readings are. A "clear change" between draws is one well beyond that spread. Run the first round in the morning, when the system has been idle overnight.
Step 1: Note the display before you open the tap
If your faucet shows a number at rest, write it down. This gives you a reference point for spotting a value that never changes.
Step 2: Watch the first draw after a rest
Open the faucet and watch the screen as the water starts. Water that has rested inside a reverse osmosis (RO) system overnight can carry a different dissolved-solids level than water produced during continuous use, because ions slowly move across the membrane while the system sits idle. That makes the first draw a natural moment for the water itself to change. Viomi's manuals describe this for their smart faucet models: the Viomi V6 PRO and Viomi V8 PRO manual explains that the TDS of the initial water drawn after inactivity first climbs and then decreases, and the Viomi M1 manual describes a temporary increase or fluctuation in outlet TDS after the unit has been idle. Both describe it as normal behavior for an RO system after sitting idle.
Fill a glass from the first water and note the faucet numbers you see while the glass fills. Set the glass aside and leave the faucet running for Step 3. Test the glass with your pen promptly, wait for the pen reading to stabilize, and record it.
Step 3: Let it run and record the stabilized value
Keep the water running until the faucet number settles, then write down that stabilized value, the same way USGS field practice records a stabilized reading. Fill a second glass mid-stream, test it with the pen, and record the pen value once it stabilizes.
Step 4: Close the valve, wait, and draw again
Close the faucet. Then open it again after about 10 minutes and again after a few hours, and each time repeat Steps 2 and 3: a first-water glass and a mid-stream glass, each with its faucet number and pen reading. Different rest times give you more pairs of readings to compare.
Step 5: Compare the faucet and pen across draws
Line up your faucet and pen readings. Compare whether the faucet and pen readings change in the same direction across draws. Your results fall into one of three patterns:
- Both move together. The faucet display is tracking changes in the water. You're done.
- The pen moves clearly and the faucet stays fixed, on more than one morning. The faucet number isn't following the changes the pen measured. Note the dates and readings in your log.
- Both stay steady. Your water is consistent from draw to draw. You can stop here and repeat the comparison at a natural checkpoint, such as after your next filter change.
Steady Readings That Are Still Live
A display that shows the same number for days isn't automatically cached. Keep these situations in mind before drawing a conclusion.
Consistent RO output. RO water is low in dissolved solids, so the same stabilized number can show up draw after draw. The pen comparison in Step 5 shows whether the water itself changed.
Air in the line after a filter change. USGS warns that gas bubbles on a probe surface distort conductivity readings. After a filter change, Viomi's manual recommends flushing until the water runs clear. Run your comparison after that flush.
Water temperature. Conductivity rises with temperature. Compare samples taken at similar temperatures, using the same sampling routine each time.
Remineralized output. Systems that add minerals back after the RO membrane intentionally raise purified-water TDS, so their stabilized reading sits higher than standard RO water.
A Simple TDS Log for Your First Week
Keeping a short log turns a vague impression ("the number never changes") into a clear record. Five or six entries over a week give you a useful picture.
| Date and time | Hours idle before draw | Display before opening | Faucet value, first water | Faucet value, stabilized | Pen value, first glass | Pen value, mid-stream glass |
|---|---|---|---|---|---|---|
| Mon 7:00 am | 9 | |||||
| Mon 6:30 pm | 2 | |||||
| Wed 7:15 am | 10 | |||||
| Sat 12:00 pm | 0 (after filling a pot) |
When your faucet columns and pen columns move together across entries, the display is tracking changes in the water. For background on what different TDS ranges mean for taste, Viomi's guide to TDS levels in water is a useful companion, and why TDS meter readings vary covers the pen side of the comparison.
How Viomi Smart Faucets Display TDS
On the Viomi V8 PRO, Viomi V6 PRO, and Viomi M1, the TDS display is built into the faucet itself, so the reading sits right where you fill your glass. That placement makes the five-step test easy: the number you watch is on the same spout the water comes out of.

Viomi V8 PRO and Viomi V6 PRO
The Viomi V8 PRO (800 GPD) and the Viomi V6 PRO (600 GPD) are 9-stage tankless RO systems with a 3:1 pure-to-drain ratio and an LCD smart faucet. The faucet displays real-time water quality (TDS) and filter life at a glance. The faucet panel shows purified water TDS alongside RO and PCB filter-life indicators and a Wi-Fi light, and the companion Viomi app shows water quality before and after filtration (TDS level), a usage report, and filter lifespan tracking.
The Viomi V6 PRO and Viomi V8 PRO manual also covers the initial rinse of a new system and the rinse after a filter replacement: "the rinse progress is displayed as 1-100, and the water output status shows the TDS value of the output water."
Viomi M1
The Viomi M1 is a 1000 GPD, 9-stage tankless RO system with remineralization, a 3:1 pure-to-drain ratio, and a touchscreen smart faucet with live TDS readings. Its faucet displays two numbers: purified water TDS and the TDS of the incoming tap water before RO filtration. The Viomi app adds the inlet water temperature and a record of water use.

Having both numbers on the faucet display is handy for this test, because you can log the tap water TDS and the purified water TDS for every draw. Testing your tap water with the pen gives you a second comparison point alongside the purified-water glass.
When you log Viomi M1 readings, keep in mind that it adds minerals back after the RO stage. Viomi's product page explains that its purified TDS reading "will naturally be higher than standard RO water," reflecting the remineralization stage. Compare Viomi M1 readings with your own earlier Viomi M1 readings rather than with a standard RO system.

FAQ
Why does the first glass in the morning sometimes read higher?
While an RO system sits unused, dissolved ions slowly move across the membrane, so the first water out after a long rest can carry more dissolved content than water produced during continuous use. It's a normal part of how RO membranes behave between uses, and it's why the first draw is such a useful moment for this test.
If my faucet TDS number never changes, is the display stuck?
Not necessarily. Steady RO output naturally produces a steady number. Measure a few draws with a handheld TDS pen, including the first draw after an overnight rest. If the pen numbers move and the faucet numbers move with them, the display is following the water.
Should my handheld TDS pen show exactly the same number as the faucet?
Expect them to track each other rather than match digit for digit, since each instrument converts conductivity to ppm in its own way. Test a glass filled mid-stream promptly, record the pen value once it stabilizes, and compare how both numbers move across several draws.
Does it matter what the display shows after I turn the water off?
The screen at rest isn't a reading of a new draw, so it isn't the number to judge. Use the numbers recorded while water is dispensing, paired with pen measurements from that same draw.
Choosing a Viomi Smart Faucet for Everyday TDS Monitoring
A TDS number on the spout makes everyday monitoring effortless: you see the reading every time you fill a glass, and a comparison like the one above happens right at the spout you already use.
- You want two numbers to compare at every draw: the Viomi M1 shows tap water TDS and purified water TDS on its touchscreen faucet, so you can log both alongside your pen readings. It also adds remineralization and delivers 1000 GPD.
- You want the faucet reading plus before-and-after TDS readings in an app: the Viomi V8 PRO pairs an LCD smart faucet showing purified water TDS with app access to TDS readings before and after filtration, at 800 GPD for busy kitchens.
- You want the same faucet and app monitoring for a smaller household: the Viomi V6 PRO offers the same LCD smart faucet and app features at 600 GPD.
Whichever system you use, read the number while water flows and compare it with a pen across a few draws. A week of paired entries gives you a clear record of how the faucet readings line up with independently measured changes in your water.
Share:
Viomi V6, Viomi V6 PRO, Viomi V8, and Viomi V8 PRO Filters: How to Buy the Right Replacement
Do Smart RO Faucet TDS and Filter Alerts Still Work Without Wi-Fi or the App?