

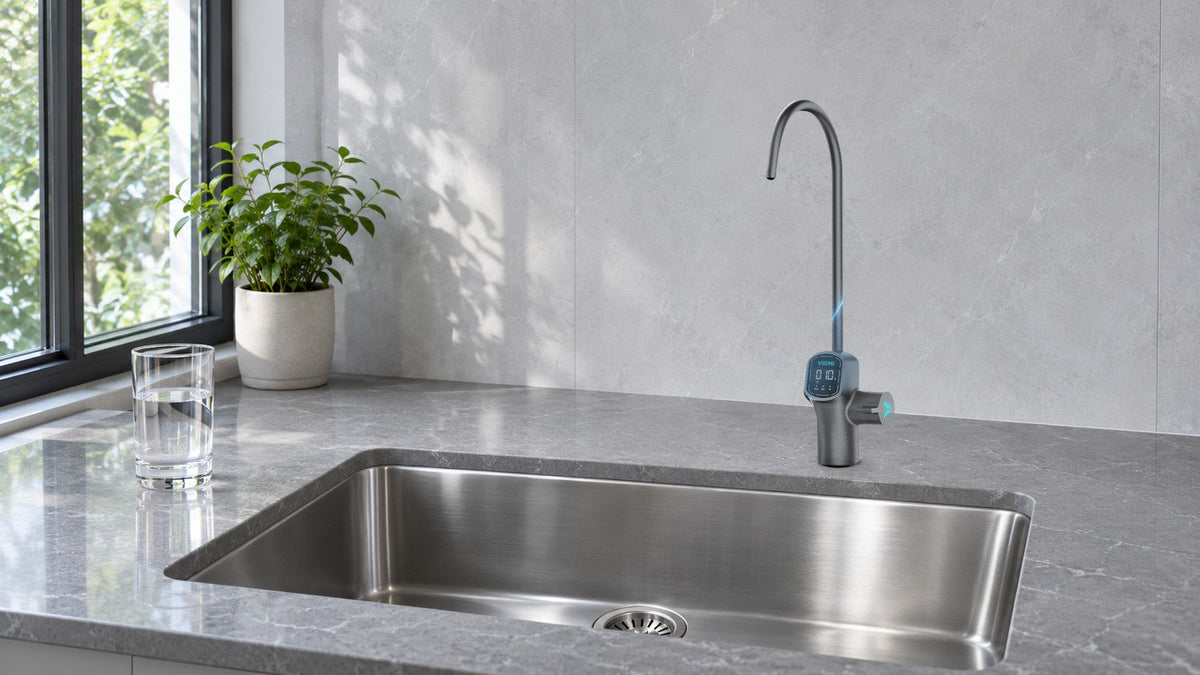
A fair TDS comparison between RO setups is a paired measurement: feed water and product water from the same supply, read with one meter that has been checked against a standard solution, sampled once the product readings meet a set steadiness rule, and repeated on more than one occasion. A difference between two setups counts only when their reduction ranges, worked out from the meter's stated accuracy, stay apart and the repeat runs agree. Systems that display both numbers make the routine easier to follow day to day: the Viomi M1 shows tap-water TDS and purified-water TDS side by side on its touchscreen faucet, and the Viomi V8 PRO app shows TDS before and after filtration.
What TDS measures and how a single reading is taken are covered in what is TDS.
Why Published Reduction Percentages Rarely Line Up
A reduction percentage looks like a fixed property of a system, but it is the result of a test, and the test conditions move it. DuPont's FilmTec technical guide on RO membrane performance explains that as feed pressure rises, salt passage is increasingly overcome because water is pushed through the membrane faster than salt can follow, and that warmer feed water raises water flow while lowering salt rejection (DuPont FilmTec).
Two figures printed on two boxes may therefore come from different feed waters, different pressures and different temperatures. Each answers its own question. A comparison that means something for a kitchen runs both setups on the same water under conditions that are controlled and written down.
The calculation is simple: feed TDS minus product TDS, divided by feed TDS, times 100. With made-up example figures, 400 ppm in and 20 ppm out works out to 95%.
Check the Meter, Then Turn Its Accuracy Into a Range
A meter check comes first. Meter makers calibrate against standard solutions of known value: HM Digital calibrates its products with a 342 ppm sodium chloride solution and notes that after prolonged use it may help to recalibrate with a commercial standard NaCl-based solution (HM Digital product maintenance), while Hanna's HI98301 calibrates automatically at one point using a 1382 ppm standard (Hanna HI98301). The example plan here adds its own session check on top of whatever calibration the meter uses: before sampling, rinse the probe, place it in a standard solution of known value, wait for a stable number and record the standard's value, the reading and the date. The plan's pass rule is a reading within the meter's stated accuracy of the standard's value; a reading outside it means recalibrating the meter and repeating the check before any samples are taken.
The accuracy statement then becomes a range in ppm, and the base of the percentage matters. Hanna states the HI98301's accuracy as plus or minus 2% of full scale on a 0 to 2,000 ppm range, which works out to 40 ppm at any reading. For contrast, take a hypothetical meter rated at plus or minus 2% of the reading itself: at a hypothetical product reading of 24 ppm, its range would be about half a ppm.
Those two ranges lead to very different conclusions. A reduction range takes its low end from the lowest plausible feed reading paired with the highest plausible product reading, and its high end from the reverse, with any product value that would fall below zero counted as zero. Using the example of 420 ppm in and 24 ppm out, the hypothetical 2%-of-reading meter places the reduction between about 94.1% and 94.5%. A meter with a 40 ppm range on both readings stretches the same example from about 83% to 100%, wide enough that two setups a few points apart cannot be ranked from those readings. Meter models and their specifications are compared in which TDS meter brands are best for drinking water.
Two habits keep extra measurement differences out of the comparison, separate from the rated accuracy itself. Read both samples with one meter and one conversion setting: TDS meters convert conductivity to ppm with a factor, and Hanna's HI98301 uses 0.5, but when the same factor scales the feed and product readings alike, the percentage reduction stays the same. Let every reading settle as well. The U.S. Geological Survey notes that conductivity rises by 0.5 to 3 percent per degree Celsius, that most modern meters compensate for temperature automatically, and that gas bubbles on the probe surface give inaccurate readings (USGS Techniques and Methods 9-A6.3). Keeping both samples at a similar temperature, waiting for a stable number and making sure no bubbles cling to the probe address each of those.
Sampling Points, Flush Volume and Timing
Feed water should match what the RO system actually receives. The best point is a cold-water outlet fed by the same line that supplies the system; in a home with a whole-house softener or filter, that means the treated line the RO actually sees. Taking the feed and product samples within a few minutes of each other reduces the chance that the supply changes between them.
Product water comes from each setup's drinking faucet after a measured flush. In the example plan used here, each product sample starts after one liter has run, and that liter is a starting point, not a guarantee. Two separate things then need to settle: the meter's display, which should hold steady before a number is written down, and the product readings themselves. The example plan's steadiness rule uses a meter that displays whole ppm: take product readings a minute apart and keep the faucet running until two in a row agree within 1 ppm, then record the total volume run before that point. Meeting that rule is what the sheet calls a steady reading. Idle time matters here: when an RO system sits unused with no pressure on the membrane, dissolved solids drift toward the purified side, a pattern described in a Water Quality Association column in PM Engineer (PM Engineer). Recording how long each setup sat before sampling lets that effect be matched between setups, and it helps explain a reading that does not fit.
Systems that add minerals after the membrane call for one more decision. On the Viomi M1, minerals are intentionally added back, which makes the TDS naturally higher than standard RO water, so a glass drawn at its faucet and read on a handheld meter describes finished mineral water. Comparing that sample with a plain RO system's product water mixes two goals. The fair pairings are mineral system against mineral system on finished water, or plain RO against plain RO.

An Example Record Sheet for Two Setups
Hypothetical figures show how the sheet fills in for two plain RO systems on the same supply, such as an under-sink unit and a countertop unit, sampled during the same sessions. The sheet assumes one hypothetical handheld meter rated at plus or minus 2% of the reading, with a whole-ppm display. The numbers are illustrations, not results for any product.
| Session (example) | Order | Setup | Idle before sample | Feed sample (time, TDS, temp) | Product sample (time, TDS, temp) | Water run before sample | Last two product readings, 1 minute apart | Reduction |
|---|---|---|---|---|---|---|---|---|
| Day 1 | 1st | Setup A | 2 hours | 7:28, 420 ppm, 64°F | 7:30, 31 ppm, 64°F | 1.5 liters | 31, 31 | 92.6% |
| Day 1 | 2nd | Setup B | 2 hours | 7:42, 420 ppm, 64°F | 7:44, 25 ppm, 64°F | 1.0 liter | 25, 25 | 94.0% |
| Day 2 | 1st | Setup B | 2 hours | 7:27, 418 ppm, 63°F | 7:29, 23 ppm, 63°F | 1.5 liters | 24, 23 | 94.5% |
| Day 2 | 2nd | Setup A | 2 hours | 7:40, 419 ppm, 63°F | 7:42, 29 ppm, 63°F | 1.0 liter | 30, 29 | 93.1% |
| Day 3 | 1st | Setup A | 2 hours | 7:29, 422 ppm, 64°F | 7:31, 30 ppm, 64°F | 1.5 liters | 30, 30 | 92.9% |
| Day 3 | 2nd | Setup B | 2 hours | 7:43, 421 ppm, 64°F | 7:45, 24 ppm, 64°F | 1.0 liter | 24, 24 | 94.3% |
Example averages: Setup A 92.9%, Setup B 94.3%. The sheet's session notes record the meter check for the same hypothetical meter against a 342 ppm sodium chloride standard, the value HM Digital uses for its own calibration; with a 2%-of-reading rating, the plan's pass range is about 335 to 349 ppm. Example notes: Day 1, reading 340 ppm, pass; Day 2, 344 ppm, pass; Day 3, 341 ppm, pass.
In this example plan, both setups are sampled in each session, with the first setup alternating from one session to the next, and each session falls on a different day. Spreading sessions across days shows how much the readings wander on their own, and alternating the order reduces the chance that a change in the supply during a session favors one setup.
Reading a Gap Between Two Setups
In the example, Setup B's product readings sit about 6 ppm below Setup A's, and the averages differ by about 1.4 percentage points. The comparison that matters is between the two reduction ranges. Applying the sheet's hypothetical meter, rated at 2% of the reading, to the average feed and product values gives Setup A a range of about 92.6% to 93.1% and Setup B a range of about 94.1% to 94.5%. Those ranges do not overlap, and the three runs on each side sit close together, so under the recorded conditions the readings show Setup B reducing TDS more. As a separate scenario, if the same readings came from a meter whose accuracy works out to 40 ppm at every reading, such as one rated at 2% of a 2,000 ppm full scale, the same averages give ranges of roughly 82% to 100% and 83% to 100%, which overlap almost entirely, so the readings cannot rank the two setups.
Rated accuracy, display resolution and run-to-run spread are three separate things. Rated accuracy is how far a reading may sit from the true value; resolution is the smallest step the display shows; and the spread across sessions shows how much the readings moved from one session to the next. The ranges above cover rated accuracy only, so they are working bounds for comparison, not statistical confidence intervals, and they do not account for sampling differences on their own. When one setup's results scatter while the other's sit close together, the first places to look are the sampling details: a skipped flush, a sample taken after an unusually long idle period, a temperature difference or a probe with a bubble on it.
TDS reduction also has a defined scope. It measures how well each setup lowers dissolved ions overall, a strong indicator of membrane performance, while the reduction of a specific substance is documented separately in test reports for that substance.
FAQ
Does a higher feed TDS make the percentage look better?
It can. If a setup lets a similar amount of dissolved solids through, a higher feed reading produces a higher percentage. Testing both setups on the same supply in the same session reduces that effect, and the feed readings recorded alongside each sample show how closely the supplies matched.
What should I do with one reading that does not fit the others?
Check the sheet for a difference in idle time, flush volume, temperature or the meter-check result for that session. If one of those explains it, repeat that run under matched conditions. If none does, keep the reading and add another run.
Can I compare my results with a published percentage?
Only loosely. A published figure comes from its own feed water, pressure and temperature, so a home sheet is most useful for setups measured side by side under the same conditions.
Does the order of sampling matter?
It helps to alternate which setup goes first from one session to the next, and to take each feed and product pair within a few minutes. Both habits reduce the chance that a change in the supply during a session favors one setup. The recorded sampling times confirm the order and spacing, and the feed readings show whether the supply moved.
Turning Paired Readings Into a Decision
A comparison earns trust when the meter has been checked against a standard, its accuracy is known as a range in ppm, every sample is taken after a matched idle time once the readings meet the steadiness rule, and the results repeat across days. When one setup's reduction range stays clear of the other's under all of those conditions, the readings support that lead for that water and those conditions. When the lead disappears inside the meter's range, the readings cannot separate the two, and the decision rests on things like cartridge upkeep, cabinet space and the finished water the household prefers.
Share:
How to Check an NSF/ANSI 372 Listing Before You Buy
Lead Reduction Certification: Check the System and the Replacement Cartridge