

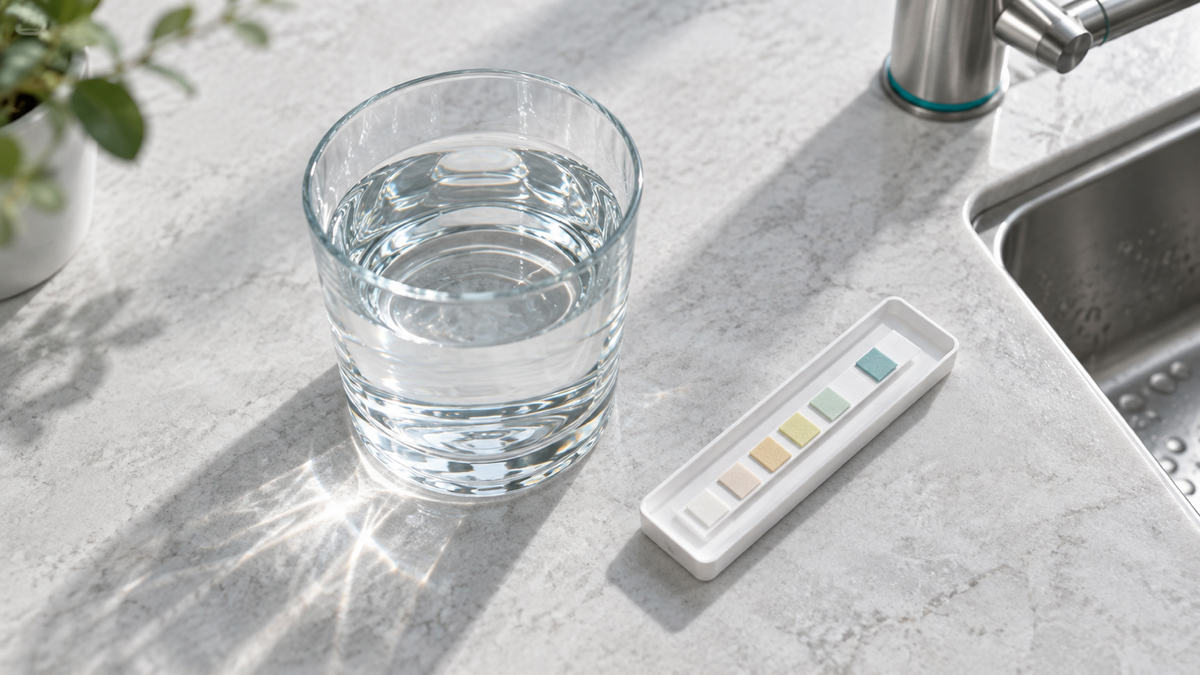
Log four numbers every time you test: the TDS of your tap water, the TDS of the first glass after the system has sat unused for eight hours, the TDS once the flowing water has passed any initial rise and fall and the readings hold steady from glass to glass, and the water temperature. The stabilized continuous-flow reading, logged next to your tap reading, is the number to trend for everyday performance. Record the first-glass TDS separately and compare it with the stabilized reading; a higher first-glass reading that returns to your usual stabilized value in the same session matches the normal idle pattern known as TDS creep.
The rest of this guide explains why those two readings differ, how to take each one so your log stays consistent, and how to read the patterns that show up over weeks and months.
What TDS Actually Measures
TDS (total dissolved solids) describes the dissolved material in water, including inorganic salts and minerals and dissolved organic matter, usually reported in parts per million (ppm) or mg/L. Handheld TDS meters estimate it from electrical conductivity. If you want a deeper primer, Viomi's complete guide to TDS and water quality testing covers the basics.
For an RO log, TDS is useful because a reverse osmosis membrane is designed to hold back dissolved salts. Logging the TDS going in next to the TDS coming out gives you a simple, repeatable view of how the system is running. TDS is a bulk reading of dissolved solids as a group; specific contaminants such as lead or PFAS are measured with contaminant-specific lab methods.
For context on tap water, the EPA lists 500 mg/L as a secondary standard for TDS. Secondary standards are non-enforceable guidelines for aesthetic effects; for TDS the EPA lists hardness, deposits, colored water, staining, and salty taste.
Why the First Glass After Eight Hours Reads Higher
Membrane manufacturers describe two different transport processes inside an RO element. Pressure pushes water through the membrane, while dissolved salts move through it by diffusion. DuPont's FilmTec bulletin explains that "there is always some salt passage through the membrane," and that pressure keeps it low because "water is pushed through the membrane at a faster rate than salt can be transported" (DuPont FilmTec, Factors Affecting RO Membrane Performance).
That difference matters the moment your faucet closes. When a tankless system sits idle, the pump stops pushing water through, but dissolved ions on the feed side keep diffusing toward the purified side. The small volume of water resting on the purified side slowly picks up those ions, and it is the first water out of the faucet the next morning.
The Water Quality Association describes the same effect: TDS can migrate to the treated side "when an RO system sits idle and there is no active pressure being applied to the raw water side of the membrane" (WQA, "Water Wisdom: Are you prepared for TDS creep?").
Viomi's manuals describe the behavior from the user's side. The Viomi V6 PRO and Viomi V8 PRO manual states that after the machine has been idle, "the TDS value of the initial water drawn will first gradually climb before decreasing," and calls this "a normal phenomenon." The Viomi M1 manual describes the same temporary rise and notes that the water from the unit "has all undergone filtration through the RO membrane."
An eight-hour window lines up with an overnight pause, which makes it easy to repeat. Keep the idle time the same every time you log so each first glass is comparable.
The Readings Worth Logging
| Reading | When to take it | How to take it | What it tells you |
|---|---|---|---|
| Tap (inlet) TDS | Same session, before or after the RO samples | Cold kitchen tap, run until cold, fill a clean glass | Your baseline for every other number |
| First-glass TDS | After an 8-hour idle, before anyone uses the RO faucet | The first 10 oz poured from the RO faucet, measured in the glass | First-glass TDS after the recorded idle period |
| Stabilized continuous-flow TDS | After any initial rise and fall, once the reading has settled | Keep the faucet open, fill 10 oz glasses back to back, and stop when the readings hold steady across successive glasses | Everyday working performance |
| Water temperature | Same session | Thermometer in the tap sample, or a meter with a temperature readout | Feed water temperature for the same test session |
| Context notes | Each entry | Date, time, idle hours, days since filter change | Lets you compare like with like |
A Repeatable Testing Routine
Consistency makes a TDS log useful. A careful single reading is less valuable than a routine you repeat the same way every week.
- Start after setup is complete. New systems and new filters go through an initial flush. On the Viomi V6 PRO and Viomi V8 PRO, the faucet shows rinse progress from 1 to 100 during the 70-second flush triggered by the first power-on of a new machine or a reset after filter replacement. Begin your log after that flush.
- Use the same meter and clean, dry glasses. Set the glasses out the night before so the first RO water of the morning goes straight into the test glass. Use the same handheld meter for every comparison so you are comparing one instrument against itself.
- Set the idle window. Stop using the RO faucet in the evening and note the time. Eight hours later, before anyone draws water, pour the first 10 oz into a clean glass. If someone uses the RO faucet during the window, note it and restart the clock on another night.
- Keep the water running. Leave the RO faucet open and fill the next 10 oz glasses back to back, then measure the first glass and each one after it in order. Continue past any initial rise and fall, and once the readings hold steady across successive glasses, log that value as your stabilized TDS.
- Measure the tap. Run the cold kitchen tap until it is cold, fill a clean glass, and record its TDS and temperature.
- Record and file. Add the readings to your log alongside the date, idle hours, and days since the last filter change.
Log once a week. Add an extra entry right after any filter change and whenever your water tastes different.
Measure the first 10 oz in the glass with the handheld meter. If your faucet has a TDS display, record its stabilized reading during continuous flow in a separate column, so each column compares like with like.

How to Read the Patterns
| What your log shows | Likely explanation | What to do |
|---|---|---|
| High first glass, then a drop to your usual stabilized number in the same session | The idle pattern described in Viomi's manuals | Keep logging |
| Stabilized TDS and tap TDS both steady | Consistent operation | Keep the routine |
| Stabilized TDS higher, tap TDS also higher | Inlet TDS rose on the feed side | Compare how far each column moved from last week |
| Flow and TDS shift between seasons | The temperature and tap TDS columns show what changed on the feed side | Line up the temperature and tap TDS columns with the purified reading |
| Stabilized TDS climbing over several weeks while tap TDS and temperature hold steady | Viomi's high-TDS troubleshooting guidance covers two items: the idle period and filter service life | Look at the filter-life indicator and plan a replacement when it is due |
When the log calls for action. For high purified-water TDS, review the recorded idle period and the filter-life indicator. Replace a filter when it is due, hold Reset for 3 seconds after replacement, and establish a new baseline after the replacement flush.
Temperature belongs in the log. The FilmTec bulletin notes that higher feed temperature raises water flux and also "results in lower salt rejection or higher salt passage," and that higher feed pressure improves salt rejection up to a plateau. Logging temperature gives you the context to read a winter reading against a summer one, and Viomi's article on cold water and RO efficiency goes deeper on how feed temperature affects flow.
Tap readings get their own column. Keeping the tap reading in every entry means a change in inlet TDS shows up in its own column instead of being mistaken for a change in the system.
Meter-to-meter differences are expected. Two meters can read the same glass slightly differently, which is why the routine uses one meter for every comparison. Viomi's guide to calibrating drift in smart water sensors covers how to keep readings consistent over time.
Remineralizing Systems Need Their Own Baseline
If your system adds minerals back after the membrane, its purified TDS is meant to be higher than plain RO water. The Viomi M1 is a 1000 GPD, 9-stage tankless RO system with a remineralization stage, and its product page notes that "the TDS reading will naturally be higher than standard RO water," reflecting "the remineralization stage, not reduced filtration performance."
For a remineralizing system, build the log around its own early readings, since the purified number includes the minerals added after the membrane. Record the stabilized TDS during the first weeks after installation as your reference, then watch for changes against that reference rather than comparing the number with a plain RO system or a friend's unit.
How Viomi Smart Faucets Fit This Routine
A handheld meter works with any system. A faucet that shows TDS while water is flowing makes the routine faster, because you can watch the reading settle in real time and write down the stabilized number when it holds.

Viomi M1. The touch smart faucet displays both the purified water TDS and the tap water TDS before RO filtration. The 10 oz preset (alongside 40 oz and 700 oz) pours the same first-glass volume every session. In the Viomi app, the Viomi M1 shows tap water TDS, purified water TDS, feed water temperature, and a usage report, which covers most of the columns in the log above. The Viomi M1 runs a 3:1 pure-to-drain ratio.

Viomi V8 PRO and Viomi V6 PRO. Both use an LCD smart faucet that displays purified water TDS, and the Viomi app shows water quality before and after filtration (TDS level), a usage report, and filter lifespan tracking. The Viomi V8 PRO is rated at 800 GPD and the Viomi V6 PRO at 600 GPD; both are 9-stage tankless systems with a 3:1 pure-to-drain ratio.
Filter life in the log. On the Viomi V6 PRO and Viomi V8 PRO, the RO filter lasts 2 years and the PCB filter 1 year. On the Viomi M1, the RO filter lasts up to 4 years and the PCB filter up to 2 years. The faucet and app show remaining filter life, and on the Viomi V6 PRO and Viomi V8 PRO the orange control panel lights come on 10 to 15 days before a change is due. After a replacement, holding the Reset button for 3 seconds returns the filter life to 100%, which is also a good moment to start a fresh baseline in your log. Viomi's article on smart sensors for filter lifespan detection explains how flow, pressure, and water-quality measurements are used in filter monitoring.
A Simple Log Template
Copy this into a notes app or spreadsheet:
| Date | Idle hours | Tap TDS | Water temp | First-glass TDS | Stabilized TDS | Days since filter change | Notes |
|---|---|---|---|---|---|---|---|
| 8 |
Keep the idle hours the same for every routine entry. If you want to capture a longer pause, such as a weekend away, log it as a separate entry with its own idle time so it does not distort your weekly trend. For trips longer than three days, Viomi's manuals recommend turning off the power and the feed water adapter; after more than seven days unused, they call for a 30-minute flush of the purified water faucet before regular use, so start logging again after that flush.
FAQ
How high can the first glass read and still be normal? Judge the first glass by what happens next. A first glass that reads higher and then returns to your usual stabilized value in the same session matches the idle pattern that membrane manufacturers and the Water Quality Association describe, and that Viomi's manuals call normal. Keep the idle time fixed so each week's first glass is comparable.
Is it fine to drink the first glass? Viomi's manuals address this directly. The Viomi V6 PRO and Viomi V8 PRO manual calls the first-draw rise a normal phenomenon that comes from a rising concentration of minerals, not pollutants, and the Viomi M1 manual states that the water from the unit has all passed through the RO membrane and can be safely consumed.
Should I judge the system by the first glass or the continuous-flow reading? Use the stabilized continuous-flow reading, logged next to tap TDS and temperature, as your performance trend. Use the first-glass reading, compared with the stabilized reading, to track idle behavior over time.
Why is my Viomi M1 reading higher than a friend's plain RO system? The Viomi M1 adds minerals back after filtration, so its purified TDS is higher by design. Compare the Viomi M1 with its own baseline from the first weeks after installation.
How often should I log? Log once a week. Add entries after each filter change and after any noticeable change in taste or flow.
Choosing a System That Makes Logging Easy
If you plan to keep a TDS log, a faucet display saves the most effort. The Viomi M1 shows tap and purified TDS together at the faucet and adds feed water temperature in the app, which makes those readings quick to record. It also delivers remineralized water and the highest output of the three at 1000 GPD. The Viomi V8 PRO (800 GPD) and Viomi V6 PRO (600 GPD) show purified TDS at the faucet and before-and-after TDS in the app, a good fit for households that want plain RO water and a simple display, sized to how much water the kitchen uses. Whichever system you choose, the routine is the same: hold the idle time steady, log the tap, the first glass, the stabilized reading, and the temperature, and watch the trend over time.
Share:
Do Smart RO Faucet TDS and Filter Alerts Still Work Without Wi-Fi or the App?
Which Filter Connection Works With a Pull-Down Faucet in an NYC Rental?