As a smart hydration specialist, I spend a lot of time helping people decode confusing specs on reverse osmosis systems. Few numbers create more debate than “desalination rate: 95% vs 98%.” On paper that sounds like a tiny three‑point gap. In real water, that difference can be either barely noticeable or absolutely crucial, depending on your feed water, recovery rate, and how the system is operated.
This article unpacks what those percentages actually mean, how they interact with recovery and energy use, and how to decide which level of desalination makes sense for your home, building, or small desalination project.
How RO Membranes Desalinate Water
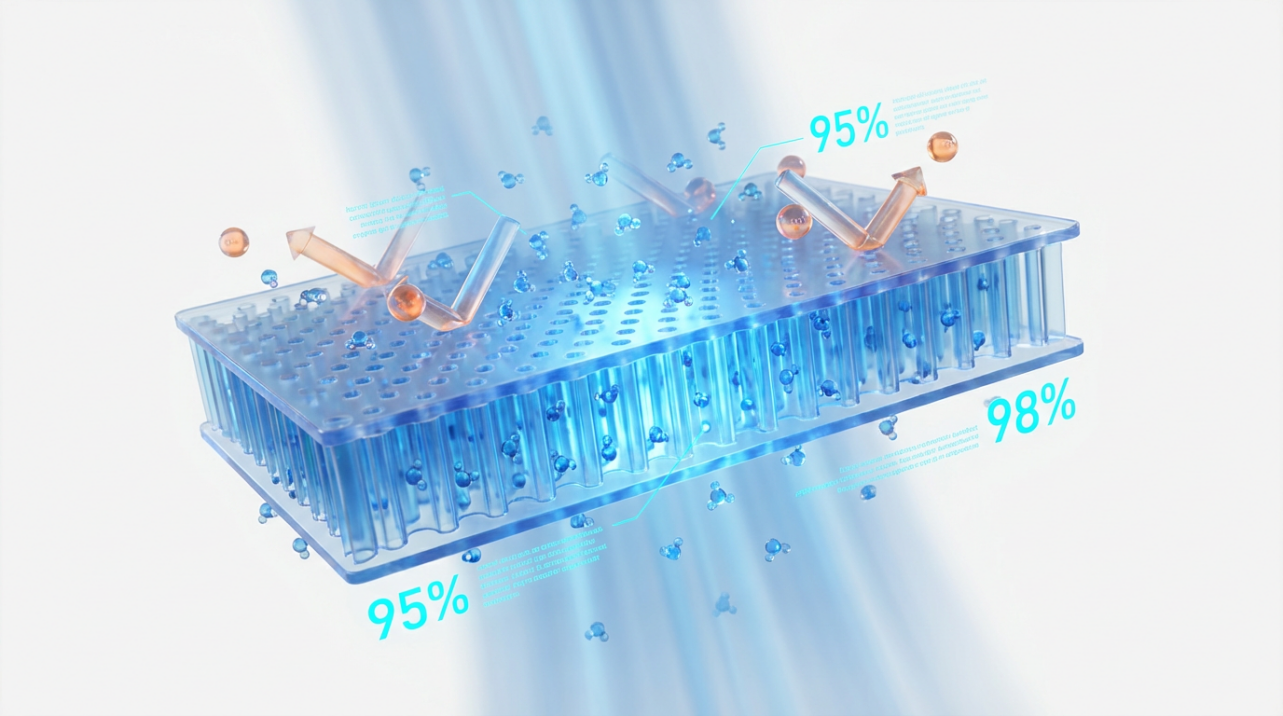
Reverse osmosis is a pressure‑driven process. A high‑pressure pump pushes water against a thin, semi‑permeable membrane whose nanoscale structure allows water molecules to pass while rejecting most dissolved salts, organic matter, and microorganisms. The membrane splits the flow into two streams: low‑salinity permeate (product water) and high‑salinity concentrate (brine).
Several research groups, including Sensorex and the U.S. Department of Energy, report that modern thin‑film composite RO membranes typically reject around 95–99% of dissolved salts under standard test conditions. That rejection percentage is what most consumer and industrial catalogs call the “desalination rate.”
From a health and hydration perspective, this is what gives RO its reputation. For seawater, technical articles from Daltonen and other desalination specialists note that RO can cut salinity from around 36,000 milligrams per liter of total dissolved solids down to roughly 200 milligrams per liter, which is a very low‑salinity water that is easy to remineralize for safe drinking.
In practice, real systems rarely operate exactly at the lab rating.

Membrane performance is shaped by pressure, temperature, recovery, feedwater chemistry, and fouling. That is why it is important to understand the second key percentage in any RO system: recovery.
Two Different Percentages: Desalination Rate vs Recovery
When people compare 95% and 98% RO membranes, they often mix up two very different concepts.
The desalination rate (or salt rejection) is the fraction of dissolved salts that the membrane keeps out of the product water. A 95% desalination membrane allows about 5% of the incoming salts through; a 98% membrane allows about 2% through, under standard conditions.
The recovery rate is the percentage of feedwater that is converted into product water. Engineers define it as product flow divided by feed flow, multiplied by 100.
Process specialists at EAI Water explain that if an RO unit receives 1,000 gallons of feed and produces 800 gallons of permeate, the recovery is 80%. That same system might use a membrane with a 95% salt rejection rating or one rated at 98%. Recovery and desalination are mathematically independent, but in a working plant they interact strongly through pressure, osmotic effects, and fouling.
Technical notes from Daltonen describe how raising recovery concentrates salts at the membrane surface, sometimes up to about four times the feed salinity. This raises osmotic pressure, reduces net driving force, and increases fouling risk. Their analysis indicates that every one‑percentage‑point increase in recovery can raise energy consumption by roughly two to three percent. At the same time, they show that every increment in pressure can increase water permeation by about two to three percent but also increases energy use and can compact the membrane.
So when you compare a “95% desalination” membrane to a “98% desalination” membrane, you cannot treat that number in isolation. The real‑world impact depends on three things working together: the salt rejection, the recovery target, and how aggressively the system is pushed in terms of pressure and pretreatment.
Turning 95% and 98% Into Real Water Numbers
To make this concrete, it helps to convert those percentages into approximate total dissolved solids (TDS) in the permeate. The math is straightforward: permeate TDS is roughly feed TDS multiplied by the fraction of salt that passes through.
The following table uses simple arithmetic to illustrate how 95% vs 98% desalination plays out at different feed salinities. The feed values are typical of municipal groundwater, hard well water, and brackish sources discussed in the RO literature.
Feed TDS (mg/L) |
95% Desalination: Approx. Permeate TDS (mg/L) |
98% Desalination: Approx. Permeate TDS (mg/L) |
300 |
15 |
6 |
1,000 |
50 |
20 |
5,000 |
250 |
100 |
10,000 |
500 |
200 |
On moderately mineralized municipal water around 300 milligrams per liter, moving from 95% to 98% desalination takes you from roughly 15 milligrams per liter to about 6. Both are very low‑TDS waters, lower than what many people drink after remineralization and blending. In everyday hydration, that difference is unlikely to be noticeable in taste or feel.
On brackish water around 5,000 to 10,000 milligrams per liter, the story changes. At 5,000 milligrams per liter, the difference is 250 versus 100 milligrams per liter. At 10,000 milligrams per liter, it is 500 versus 200. At those feed salinities, that three‑point jump in desalination rate can cut the remaining mineral content by more than half.
In seawater desalination, research on large plants shows RO reducing salinity from about 36,000 milligrams per liter down to around 200. That corresponds to very high overall desalination, and operators often combine multiple stages, careful recovery control, and sometimes specialized membranes to get there.
The takeaway is that moving from 95% to 98% desalination has a small absolute impact on already low‑salinity feedwaters and a major impact on high‑salinity sources.
Where Higher Desalination Really Matters
High‑Salinity and Challenging Feedwaters
In brackish and seawater desalination, feed salinity drives both cost and membrane stress. A comparative study of large seawater plants using different feed sources, published in a membrane science journal, showed that higher‑salinity feed from one sea required far more membrane area and higher pressures than lower‑salinity feed from another sea to produce the same volume of fresh water. The higher‑salinity option had substantially higher membrane capital costs, intake and pretreatment costs, and energy use.
In that context, every extra percentage point of desalination makes a big difference. If you are starting with 10,000 milligrams per liter, staying at 95% can leave you around 500 milligrams per liter in the product stream, while pushing up toward 98% cuts that to roughly 200. That can be the difference between a permeate that is just on the edge of desirable clarity and one that is comfortably low in salts, even before blending and remineralization.
Higher desalination is also valuable where the RO permeate is used directly to feed sensitive processes such as boiler makeup, certain industrial rinses, or high‑purity manufacturing. In those cases, downstream polishing steps are still common, but starting with lower TDS from the RO stage reduces the burden on mixed‑bed ion exchange, electrodeionization, or further membrane polishing.
Typical Municipal Tap or Well Water
For most homes on municipal water or moderately hard wells, feed TDS is often in the few hundred milligrams per liter range. At that salinity, both 95% and 98% desalination produce very low‑TDS product water. Going from 50 milligrams per liter down to 20, or from 15 down to 6, is numerically significant but rarely the main determinant of taste, safety, or overall hydration.
From the perspective of day‑to‑day water wellness, the factors that matter more are:
Whether the system has good carbon filtration to remove chlorine and organic by‑products before the membrane.
Whether the RO system is installed with appropriate remineralization to restore beneficial alkalinity and taste.
Whether the unit is maintained so that the membrane, pre‑filters, and storage tank do not become microbial or particulate hotspots.
In other words, for typical home hydration, a well‑designed 95% desalination membrane often delivers excellent results, and the extra desalination margin of a 98% membrane tends to be more about engineering pride than noticeable health benefit, as long as the rest of the system is properly engineered and maintained.
Specialized Uses: Aquariums, Labs, Health‑Sensitive Settings
There are niche applications where squeezing out those last few milligrams per liter really does matter. Reef aquariums, certain laboratory protocols, and some medical device reprocessing standards reference extremely low ionic content.
Technical literature from the water treatment and healthcare sector describes how pharmaceutical and biotechnology processes rely on RO to meet tight purity standards, sometimes followed by further polishing steps, because trace ions can affect reactions and product stability. In those settings, higher‑desalination membranes can reduce the load on downstream polishing, stabilize quality, and add a safety margin against temporary performance dips.
For a serious reef hobbyist or a lab that is using RO as the first barrier before deionization, the step from 95% to 98% desalination can be justified, especially when paired with robust monitoring of conductivity and total dissolved solids.
System‑Level Trade‑Offs When You Chase Higher Desalination
Pressure, Energy, and Membrane Stress
Higher desalination usually implies stronger separation at the membrane surface. Physically, this is tied to how water and salts move through the thin polyamide layer under pressure. Analyses of RO performance in scientific journals emphasize a fundamental trade‑off: structural modifications that increase water permeability often allow slightly more salt to pass, and modifications that tighten salt rejection often lower permeability.
Daltonen’s analysis of RO operation notes that increasing feed pressure by a single bar can raise water permeation by roughly two to three percent but also increases energy use by about one and a half to two and a half percent. Over time, high pressures can compact the membrane, reducing permeability and shortening its effective life.
When plant operators insist on very high desalination and high recovery simultaneously, they often respond by increasing pressure. This can keep salt passage down in the short term but raises specific energy consumption and mechanical stress on the membrane elements and high‑pressure pumps.
From a smart hydration perspective, I often see more sustainable long‑term performance when systems are designed with slightly more membrane area and moderate pressures, rather than forcing a small membrane set to operate at the ragged edge of its limits just to hit a higher desalination spec on paper. The research pointing to membrane compaction under high pressure supports this practical experience.
Recovery, Brine Volume, and Concentration Polarization
Recovery interacts with desalination in subtle ways. Reaching 98% desalination at a very low recovery, where most of the salts remain in the brine, is one thing. Maintaining that desalination when you aim for 70% or 80% recovery is more difficult.
EAI Water describes how increasing recovery from 70% to 80% yields about ten percent more product water and can cut wastewater volumes significantly. At the same time, they caution that higher recovery concentrates impurities in the remaining feed, which increases the risk of scaling and fouling. Their broad design experience suggests seawater plants often choose recoveries around 35–50%, while brackish water systems target 60–80%, balancing water yield and fouling risk.
Daltonen’s work explains why. As recovery rises, salt concentration at the membrane surface can reach up to about four times the feed level. That sharply raises osmotic pressure, which reduces net driving force and makes it harder to keep salt rejection as high as the membrane’s laboratory rating. Their calculations show that each percentage‑point increase in recovery tends to increase energy demand by two to three percent and accelerates fouling.
In practical terms, this means that maintaining 98% desalination at very high recovery levels often requires either more conservative set‑points, extra membrane area, or more aggressive pretreatment and cleaning. Otherwise, what is sold as a “98%” membrane may operate much closer to the mid‑90s in real life as fouling and concentration polarization set in.
Temperature and Salt Passage
Temperature is another important variable that interacts with desalination. Daltonen’s summary of empirical data notes that water production typically increases by roughly two and a half to three percent for every small increase in feed temperature, because warmer water is less viscous and diffuses more easily. However, they also emphasize that higher temperature increases salt passage, reducing desalination efficiency.
That means a membrane that reaches 98% desalination in cool laboratory conditions might show slightly lower desalination in a hot mechanical room, even with the same pressure and recovery settings. Conversely, colder feedwater will improve salt rejection but reduce permeate flow, which can encourage operators to raise pressure and therefore energy use.
Well‑instrumented systems that track both flow and conductivity or TDS can see these trends clearly across seasons. That is why desalination percentages are best understood as performance bands achieved under specific operating windows rather than fixed, absolute properties.
How Pretreatment and Maintenance Shape Real‑World Desalination
Researchers who study fouling in RO systems underscored in a detailed review that pretreatment is not an optional extra; it is central to sustaining flux, salt rejection, and membrane life. They describe pretreatment trains that combine coagulation and flocculation, dissolved air flotation, granular media filtration, and sometimes microfiltration or ultrafiltration. These steps remove suspended solids, organics, and microorganisms before the water ever reaches the RO stage.
In trials summarized in that review, ultrafiltration pretreatment achieved silt density index values below about 2.5 and removed nearly all turbidity, while reducing biofilm‑forming bacteria far more effectively than conventional media filtration alone. Hybrid systems that combined sand filtration, microfiltration, and ultrafiltration achieved removal rates above 98% for many contaminants, leading to higher stable RO recoveries.
These findings match field experience in desalination plants. IDE’s operational reports on large seawater plants emphasize that membranes are the highest‑value components, and that disciplined membrane management programs which monitor fouling, scaling, and performance trends can significantly extend membrane life and minimize replacement. They highlight how scaling and fouling are a leading cause of performance drop, not just in flux but in product water quality.
For a homeowner or building manager, the lesson is clear. Even a premium 98% desalination membrane will not deliver that level of performance for long if the pre‑filters are undersized, not changed on schedule, or not designed for the actual feedwater. Conversely, a well‑pretreated system with moderate recovery and careful operation can keep a 95% membrane performing near its rating for many years.
Choosing Between 95% and 98% for Home and Small‑Scale Systems
When a 95% Membrane Is Usually Enough
On typical municipal water and many private wells, a good 95% desalination membrane, combined with carbon pre‑filtration and post‑treatment, is usually sufficient for excellent drinking water. In these settings, the numerically higher desalination rating often does not translate into a meaningfully different hydration experience.
What tends to matter more is whether the unit:
Is designed with an appropriate recovery level for the feedwater, usually in the moderate range where scaling risk is controlled and membrane stress is not excessive.
Has robust pretreatment so that silt, hardness, iron, and organics are not constantly attacking the membrane.
Includes remineralization so that the final water has a pleasant taste and balanced mineral profile.
From visits to homes where people had switched from standard 95% membranes to “ultra‑high” desalination models, I consistently see that the biggest improvements correlate with better pretreatment and plumbing upgrades, not the three percent bump in the membrane spec sheet.
When a 98% Membrane Can Be Worth It
There are scenarios where a 98% membrane is a smart, science‑backed choice.
The first is high‑TDS groundwater, such as wells with several thousand milligrams per liter of dissolved solids. In those cases, moving from 250 milligrams per liter permeate down to 100 or from 500 down to 200 can noticeably reduce scaling in kettles and coffee equipment and can make mixing ratios for remineralization more flexible.
The second is small‑scale brackish or seawater desalination systems where the RO permeate is used with minimal blending. Studies on seawater reverse osmosis show that lower feed salinity and higher net driving pressure dramatically improve economics and allow fewer membrane elements, but for unavoidable high‑salinity feeds, having a membrane that can reliably push the product salinity down into the low hundreds makes the rest of the process, including post‑treatment, more straightforward.
The third is specialist use: reef aquariums, sensitive lab work, or certain medical applications where extra desalination lowers the burden on downstream polishing and adds a safety margin when operating conditions are not perfectly controlled.
Even in these cases, the membrane choice should be paired with careful design of recovery, pretreatment, and monitoring. Technical guidance from energy and water agencies consistently recommends life‑cycle cost thinking: sometimes the smarter play is a slightly lower desalination membrane operated conservatively with excellent pretreatment, rather than a very tight membrane pushed hard on a marginal pretreatment train.
How to Keep Your RO System Close to Its Rated Desalination
Regardless of whether you choose a 95% or 98% membrane, there are practical steps that keep actual performance close to the rating.
First, match recovery to your feedwater and membrane. EAI Water and other design groups generally target recoveries in the 60–80% range for brackish water and lower values for seawater, based on detailed scaling calculations. Running at the highest possible recovery is not always the most economical point once increased energy use, fouling, and membrane replacement are included.
Second, invest in pretreatment appropriate to your feed. For turbid groundwater, that might mean coagulation and multimedia filtration. For iron‑rich or organic‑rich wells, it may involve oxidation and carbon. For very challenging surface waters, membrane‑based pretreatment such as microfiltration or ultrafiltration may be warranted. The fouling review in PubMed Central makes it clear that no single step is a silver bullet; the most robust systems combine several complementary processes.
Third, monitor both quantity and quality. Instruments such as conductivity or TDS meters on both permeate and concentrate lines give a near‑real‑time picture of salt rejection. When paired with differential pressure and flow measurements, they help detect fouling, scaling, or membrane damage before performance deteriorates severely. Field reports from IDE and others show that plants with structured monitoring and intervention programs maintain both flux and salt rejection far better over time.
Finally, respect temperature and pH limits. Membrane manufacturers and the scientific literature warn that operation outside recommended pH ranges or at high temperatures can damage polyamide layers and permanently reduce performance. The fouling review notes that oxidizing disinfectants such as free chlorine, ozone, and high concentrations of hydrogen peroxide are particularly aggressive to polyamide membranes and should be confined to pretreatment, with careful control and appropriate neutralization before the RO stage.
In my experience, when users follow these principles, the question of 95% versus 98% shifts from a heated debate to a fine‑tuning choice, because both options deliver excellent, predictable water quality.
Brief FAQ
Is 98% desalination always better than 95%?
Not automatically. On high‑salinity feedwaters and for very sensitive uses, the extra desalination margin can be very valuable. On typical municipal or moderately hard well water, the difference in everyday hydration is often subtle, and system design, pretreatment, and maintenance tend to dominate real‑world water quality.
Does higher desalination mean much higher energy bills?
Research summarized by Daltonen and by energy agencies shows that energy use is more sensitive to recovery and pressure than to whether the membrane is rated at 95% or 98%. Chasing very high recoveries or using unnecessarily high pressures increases energy and membrane stress. A well‑designed system with moderate recovery and appropriate pressure can keep energy use reasonable for either membrane rating.
If my current RO system already tastes great, is it worth upgrading just for 98%?
If your feedwater is not extremely salty and your product water already tastes clean and is backed by good test results, upgrading solely for the higher desalination number is rarely the best investment. In most cases, the money is better spent on improved pretreatment, fresh pre‑filters, a quality remineralization stage, or better monitoring.
Choosing between 95% and 98% RO membranes is less about chasing a bigger number and more about aligning membrane performance with your source water, recovery strategy, and maintenance habits. When you treat those percentages as tools in a holistic design rather than standalone badges of quality, you unlock the full potential of reverse osmosis to deliver safe, great‑tasting, and sustainable hydration at home or in your facility.
References
- https://www.energy.gov/femp/articles/reverse-osmosis-optimization
- https://pmc.ncbi.nlm.nih.gov/articles/PMC10102236/
- https://dspace.mit.edu/bitstream/handle/1721.1/122632/OKAMOTO%20Manuscript%20final.pdf?sequence=2
- https://www.frontiersin.org/journals/membrane-science-and-technology/articles/10.3389/frmst.2023.1169158/full
- https://www.watertreatmentguide.com/factors_affecting_membrane_performance.htm
- https://eaiwater.com/ro-recovery-rates/
- https://m.fr.cn.host0.ogesz.com/info-detail/do-you-know-what-factors-affect-reverse-osmosis-desalination-rate
- https://sensorex.com/understanding-reverse-osmosis-desalination-process/?srsltid=AfmBOopKj8g8rTsTb3WPQvW3v1alWWJaQ1C3ynSvakSs0uk25f3dH6-r
- https://www.axeonwater.com/blog/operational-facts-about-reverse-osmosis-membranes/
- https://daltonen.com/blogs/blog/reverse-osmosis-membrane-recovery-and-water-production-rate-relationship

Share:
Impact of Membrane Fiber Density on RO Performance Analysis
Understanding the Importance of Anti-Siphon Features in RO Systems